- Published on
Learnings From User-Centric Performance
- Authors
- Name
- Paul Chong
- @paulhyunchong


The performance of your web application is key to the success of your conversions, page views, and business. But what exactly is performance?
You could have a web page that loads quickly and defers the loading of components on the page, but that initial load might not have anything immediately useful for the user. Would this be categorized as great performance?
Questions to Think About
To standardize and define what makes a web page performant, the Chrome team and W3C Web Performance Working Group came up with ways to identify performance by thinking about not only speed but also usefulness and relevance to the user. These are known as metrics: objective criteria that can be quantitatively measured.
The questions below help us to understand what criteria we are looking for when defining our metrics. Is it:
Happening? Did the navigation start successfully? Has the server responded?
Useful? Has enough content rendered that users can engage with it?
Uable? Can users interact with the page, or is it busy?
Delightful? Are the interactions smooth and natural, free of lag and jank?
Types of Metrics
With these questions in mind, we can start to look at the types of metrics that are relevant to how users perceive performance.
Perceived load speed: how quickly can we load the page and all of its visual elements?
Load responsiveness: how quickly can we load, parse, and execute JS so that user can interact with the page?
Runtime responsiveness: how quickly does the page respond to user interactions?
Visual stability: do any elements on the page shift/move around or block user interaction?
Smoothness: do animations and visual elements move at a consistent FPS?
As you can see there are many types of metrics we can measure and test for and they are all key to the perceived performance of a page. Being great at one type of metric alone will not guarantee you success. You could have a quick load time but janky animations or slow responses to user interactions will negatively impact the perceived performance of your application.
The Metrics
To quantitatively measure the questions above, the Chrome team and W3C WPWG came up with these metrics for developers to understand the performance of their applications:
First Contentful Paint: time it takes from page load to first element to be rendered on the screen.
Largest Contentful Paint: time it takes from page load to largest text or image element to be rendered on the screen.
First Input Delay: time it takes from a user's interaction to time it takes browser to respond to the interaction.
Time to Interactive: time it takes from page load to when the page is visually rendered, JS has finished loading, and is able to respond to user input.
Total Blocking Time: time from FCP to TTI (this chunk of time is where the main thread is blocked, preventing user input)
Cumulative Layout Shift: measures the cumulative score of all unexpected layout shifts that occur between when the page starts loading and when its lifecycle state changes to hidden. Hidden means the desktop of the user is occupied by other windows, and the page is not visible but has not been frozen.
First Contentful Paint
First Contentful Paint measures the time from when the page starts loading to when any part of the page's content is first rendered on the screen.


Above is a screen capture of Reddit's page load. You can see on the first frame there's no content but on the second frame there's content being loaded in. This is where FCP happens: when text and images first begin to be rendered. To provide a good user experience, Google recommends that FCP should happen under 1 second after the page has started to load.
There are some things you can do to improve your FCP:
- Eliminating render blocking resources
- Minifying CSS
- Preconnecting to required origins
- Reduce server response times (TTFB)
- Preload key requests
- Avoid enormous network payloads
- Serve static assets with an efficient cache policy
- Avoid an excessive DOM size
- Minimize critical request depth
- Keep request counts low and transfer sizes small
There's an underlying theme here with regards to improving your FCP: send users smaller initial payloads for quick load times. The key here is to send users exactly what they need and nothing more to get that quick initial load. Then you can use techniques such as lazy loading and dynamic imports/code splitting to get your users the rest of the content they need.
You can see an example of lazy loading by visiting Reddit and viewing all of those skeleton loaders. Instead of rendering all of their content on initial load, Reddit shows the "skeleton" of the page via skeleton loaders and then lazily loads their content. This way of loading is not only great for your performance numbers, but also for the perceived performance by users.
To learn more about FCP and how to improve it, go here: web.dev - First Contentful Paint.
Largest Contentful Paint
Largest Contentful Paint measures the time from when your page loads to when the largest element in your viewport is finished rendering. According to the Largest Contentful Paint API, elements that are considered for LCP are:
<img /><image>inside of an<svg><video>- Elements with
background-image: url() - Block-level elements containing text elements.
Take a look at this example of ESPN on mobile:

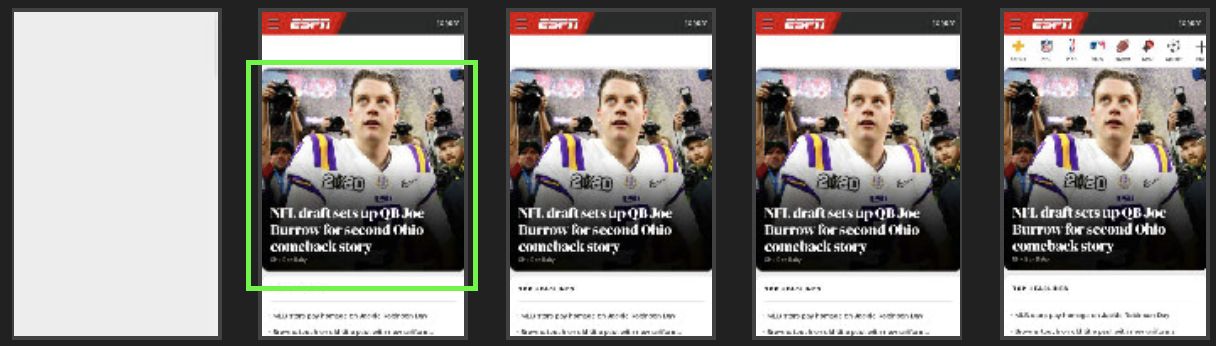
The largest element in view is highlighted in green. Since all the elements around it are smaller, it will remain the largest element throughout the load process and it looks like it loaded in by the second frame, which is pretty good. How does the browser record the largest contentful element?
When the page initially loads, the browser dispatches a PerformanceEntry of type largest-contentful-paint which will record the largest contentful element as soon as the browser has painted the first frame. But what if a larger element loaded into the viewport after it records a largest element?
As the page continues loading and more elements start to render, the browser will dispatch another PerformanceEntry any time the largest contentful element changes. Note that an element will only be considered largest contentful element if it is fully rendered and in view for the user. This process of finding the largest contentful element stops once the user interacts with the page via tap, scroll, or keypress.
For a good user experience, Google designates that LCP should happen under 2.5 seconds after the page has started to load. The biggest factors that can slow down LCP are slow server response times, CSS blocking time (render/paints are slow), and slow asset load times. To alleviate these issues, Google recommends the following:
- Apply instant loading with the PRPL Pattern
- Pre-load the most important resources.
- Render the initial route as soon as possible.
- Pre-cache remaining assets.
- Lazy load other routes and non-critical assets.
- Optimize the Critical Rendering Path
- Optimize CSS, Images, Web Fonts, and JS (if client-rendered)
I will be diving into the PRPL Pattern tomorrow. 🔍
To learn more about LCP and how to improve it, go here: web.dev - Largest Contentful Paint.
First Input Delay
First Input Delay helps measure your application's interactivity and responsiveness to user input. It is measured from when the user first interacts with the application (via taps, key presses, and clicks) to the time the browser is able to respond to the interaction.
What causes input delay? Input delays happens when the browser's main thread is busy doing something so it can't respond to the user (this is also known as blocking). One of the biggest offenders is JavaScript and the time it takes to download, parse, and execute it; while the browser is doing this, it can't run any event listeners, which handle user interactions. If the user interacts with the application while the browser is busy completing a task in the main thread, the interaction will only start after the task on that main thread is complete. The time the first interaction is started until the time it is completed is called first input delay.
Google recommends aiming for < 100ms FID for a great user experience. Here are some ways you can improve First Input Delay:
- Reduce the impact of third-party code such as ads
- Reduce JavaScript execution time
- Code splitting
- Minimize main thread work
- Keep request counts low and transfer sizes small
- Send only resources the user needs and then defer/lazily load remaining content
To learn more about FID and how to improve it, go here: web.dev - Largest Contentful Paint.
Time to Interactive
Time to Interactive measures the time from when the page starts loading to when its main sub-resources have loaded so that your app can reliably respond to user input. In technical terms, this is the time of the last long task before the quiet window.
- A long task is any task in the main thread that takes longer than 50ms.
- The quiet window is a 5-second period of time where there are no long tasks and no more than two in-flight network GET requests.
When optimizing for performance, developers look to achieve fast initial render times. This was achieved in ways such as server-side rendering but this technique can cause higher TTI due to the fact that the page is visually rendered but not interactive immediately since the main thread is blocked downloading JS (which enables the interactivity of the elements on the page). To remedy this issue, Google recommends minimizing the time between FCP and TTI and/or having visual indicators that tell users intuitively that the element is not interactive yet.
Google recommends having a TTI of < 5 seconds and recommends these improvements, if applicable:
- Minify JavaScript
- Preconnect to required origins
- Preload key requests
- Reduce the impact of third-party code
- Minimize critical request depth
- Reduce JavaScript execution time
- Minimize main thread work
- Keep request counts low and transfer sizes small
As you can see, many of the suggestions here overlap with suggestions from the other performance metrics optimizations. Make it a key point, when developing, to have these optimizations in mind.
To learn more about TTI and how to improve it, go here: web.dev - Time to Interactive.
Total Blocking Time
Total Blocking Time measures the total amount of time between FCP and TTI. This is where the main thread is blocked for long enough to prevent user input responsiveness. When a user interacts with your application in the middle of a long task, the browser must wait for the task to finish before it can respond to the user input. If the task is long enough (> 50ms according to research), the user might notice a delay and the interaction will feel slow and/or janky.
Google recommends a TBT of less than 300 milliseconds and recommends these improvements:
- Reduce the impact of third-party code
- Reduce JavaScript execution time
- Minimize main thread work
- Keep request counts low and transfer sizes small
To learn more about TBT and how to improve it, go here: web.dev - Total Blocking Time.
Cumulative Layout Shift
Cumulative Layout Shift measures the sum of the individual layout shift scores for each unexpected layout shift that occurs between when the page starts loading and when its lifecycle state changes to hidden.
Via the Layout Shift API, layout shifts are defined as any time an element that is visible in the viewport changes its start position between two frames. There is a calculation done to figure out the layout shift score: the impact fraction * the distance fraction.
- Impact fraction: measures how unstable elements impact the viewport area between two frames.
- For example, say you render an element that is full width, 100px tall, and positioned at (0,0). If you were to move it to position (0, -50), the impact fraction would be 150.
- Distance fraction: measures the distance that unstable elements have moved, relative to the viewport. It is the greatest distance any unstable element has moved in the frame (either horizontally or vertically) divided by the viewport's largest dimension (width or height, whichever is greater).
Layout shifts that occur within 500 ms of user input are excluded from calculations since not all layout shifts are bad! Also elements that move via the CSS property transform are excluded.
Google recommends a CLS of < 0.1. To improve your CLS score follow these guidelines:
- Always include size attributes on your images and video elements, or otherwise reserve the required space with something like CSS aspect ratio boxes to prevent jumping of content.
- Never insert content above existing content, except in response to a user interaction.
- Not all layout shifts are bad!
- Prefer transform animations to animations of properties that trigger layout changes.
To learn more about CLS and how to improve it, go here: web.dev - Cumulative Layout Shift.
Final Thoughts
There are definitely many ways you can improve the performance of your application and not all of these optimizations may work for you. Do not go blindly applying performance optimizations just because a performance tool tells you to. You should first look at the needs and goals of your business or application, measure your current performance and progress to your goals, and then optimize as needed. As you test your applications for performance, remember to test in both simulated, controlled environments such as WebPageTest and on real users/devices.
Go here to learn more about User-Centric Performance!